| OVERVIEW
Building on the concepts presented in our Dividends Are Different article, here we present data and observations highlighting how dividends can protect investors from inflation and market volatility. While this content is relevant to other applications, we focus on it within the context of retirement income. When designing portfolios to provide for retirement, conventional wisdom holds that allocations to stocks generally facilitate growth that helps hedge against inflation. We agree with this notion, but try to make it more concrete by highlighting the fundamental and market-based mechanics behind this relationship. We then look at empirical data to investigate how inflation relates to market prices, earnings, and dividends. We measure results over 25-year time periods – fairly typical horizons for retirement planning. Our findings reveal impressively strong relationships between fundamental performance and inflation, but an unsurprisingly weaker linkage between market returns and inflation. Relative to chiseling away from a portfolio, we believe dividends provide a more direct tool to combat inflation as they avoid the layer of noise imposed by often-volatile market prices. This can be especially important when inflation surfaces as asset prices may react negatively – thereby requiring higher withdrawals when asset prices are depressed. This situation can impose permanent damage on retirement security and is why retirement researchers identify inflation as such a critical risk. |
Source: Robert J. Shiller market data, Aaron Brask Capital
OutlineThis article is organized in three primary sections followed by our concluding remarks. The first section highlights theory and mechanics that relate inflation to stocks price movements. The second section quantifies these notions and presents our empirical findings. The third section discusses the potential roles dividends can play in the context of addressing and managing market risk. |
Theory relating inflation to stock price movements
When it comes to investing for retirement, conventional wisdom holds that allocations to stocks generally facilitate growth that helps hedge against inflation. The following highlights what we believe are the key fundamental and market-based mechanics that drive this relationship.
At the root level, shares of stock represent profit-seeking enterprises and these businesses require capital to acquire resources (e.g., PP&E[1], raw materials, and labor), alter or assemble them, and turn them into something they can sell to their customers. This capital naturally demands a return. Thus, as inflation increases input costs, maintaining the required return on this capital will increase the absolute level of profit. Put simply, profits should rise with inflation under these assumptions.
Of course, economic forces do not follow a set schedule or formula. Innovation and competition involve much trial and error. Moreover, companies ultimately rely on humans to make decisions. On an individual basis, this introduces some subjectivity into their fundamentals. However, the level of entropy is increased as they interact and create feedback loops. The bottom line is that the inflation-profit model described above will naturally involve significant noise.
Notwithstanding this randomness, as long as survival instincts, profit motives, and competition exist, the above logic regarding returns on capital will apply and help explain why profits, and thus stock prices, should be positively correlated with inflation over the longer term.
| “In the short run, the market is a voting machine but in the long run, it is a weighing machine.”
– Benjamin Graham (Warren Buffett’s mentor) |
While the relationship between inflation and profits is already noisy, market-based forces make the relationship between inflation and stock prices more tenuous. We firmly believe prices follow fundamental performance over the long term. However, investor sentiment can influence prices over shorter periods. This notion is particularly relevant in the context of inflation. Historically, we have witness periods where investors reacted negatively to significant bouts of inflation and we suspect that is due to them assuming (implicitly or explicitly) a higher interest rate is warranted for discounting future cash flows. However, this reaction ignores the phenomenon we highlighted above and will illustrate below with historical data – i.e., that inflation appears to give rise to increasing profits over the longer term.
| “Inflation is truly the great enemy of the retiree.”
– William Bengen[2] |
In the context of retirement, inflation can require one to withdraw more money to maintain the same standard of living. Moreover, the threat is magnified to the extent that a sustained uptick in inflation can increase prices for the remainder of one’s retirement. Even worse, negative market reactions during inflationary periods can add further risk to this situation. On the one hand, inflation may force an increase to the dollar amount of portfolio withdrawals. On the other hand, each dollar of withdrawal may require selling more shares or bonds in an environment where their prices are depressed. This is why academics and practitioners view inflation as such a significant threat to retirement security.
Empirical results
The goal of this section is to illustrate the historical relationship inflation has had with corporate fundamentals (i.e., earnings and dividends) and stock prices. We use Robert J. Shiller’s online data for S&P 500™ prices, earnings, and dividends. We start out by investigating these relationships over 25-year time periods as we believe this can help us address some of the noise highlighted above and identify longer term trends. Moreover, 25 years is a reasonable period to consider in the context is retirement planning.
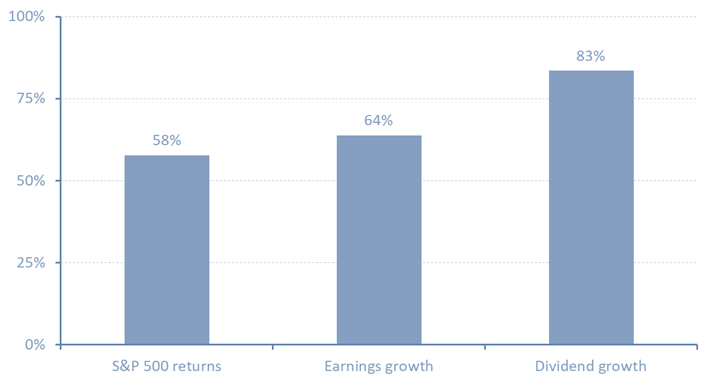
Figure 1 on the front page shows how stock prices, earnings, and dividends were correlated with inflation over 25-year periods. It shows impressively strong relationships between fundamental performance and inflation, but an unsurprisingly weaker linkage between market returns and inflation. S&P 500 returns were 58% correlated with inflation while earnings and dividends exhibited correlations of 64% and 83%, respectively.
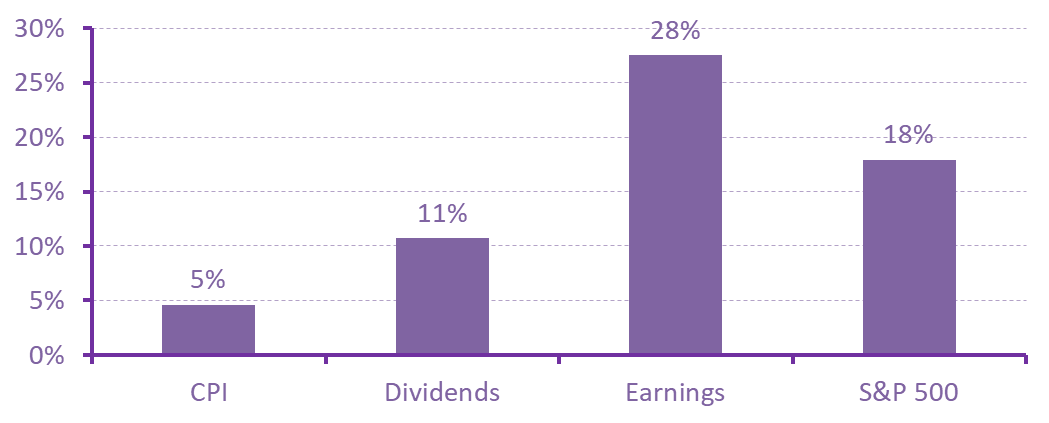
Figure 2: Standard deviation of growth rates (25-year periods)
 |
Source: Robert J. Shiller market data, Aaron Brask Capital
We also calculated how volatile these quantities were by measuring the standard deviation of their growth rates.[3] Figure 2 above shows these results. CPI exhibited the least volatility with a standard deviation of 4.6%. We suspect this primarily due to the slow-moving forces of supply and demand, but hedonic adjustments to CPI figures[4] and central bank mandates for price stability may also be factors. The standard deviations for dividends, earnings, and S&P 500 prices were all higher at 10.7%, 27.5% and 17.9%, respectively.
Interestingly, earnings showed the highest volatility. We believe this is due to the apples-oranges nature of the comparison. For example, each earnings figure represents the profits of the underlying companies reported over a particular period. However, market prices represent an average of expected earnings over many different periods. Moreover, earnings figures can be arbitrarily small over some periods (no negative readings in the data we used). Thus, percentage-based growth figures calculated from lower levels may accelerate rapidly. It is also worth noting that dividend volatility might also be lower due to the discretion CEOs and CFOs have in declaring dividends. Indeed, they have the ability to dig into retained earnings and pursue what they expect will be sustainable dividend policies despite fluctuations in their earnings.
Even if they exhibited the highest correlations with CPI or the lowest level of volatility, earnings are not accessible, except to the extent they are paid out as dividends. That is, only share prices and dividends represent tangible, liquid money investors can use for spending. As such, earnings are effectively irrelevant in the context of retirement where one requires liquidity.
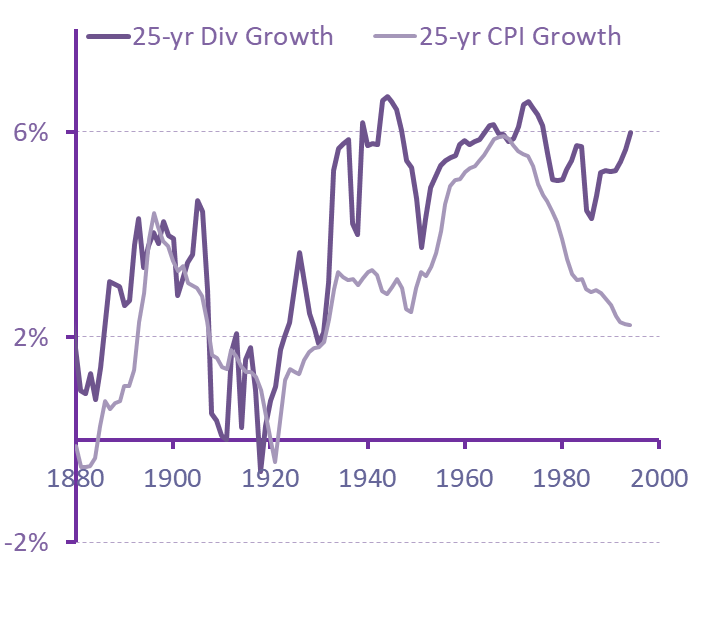
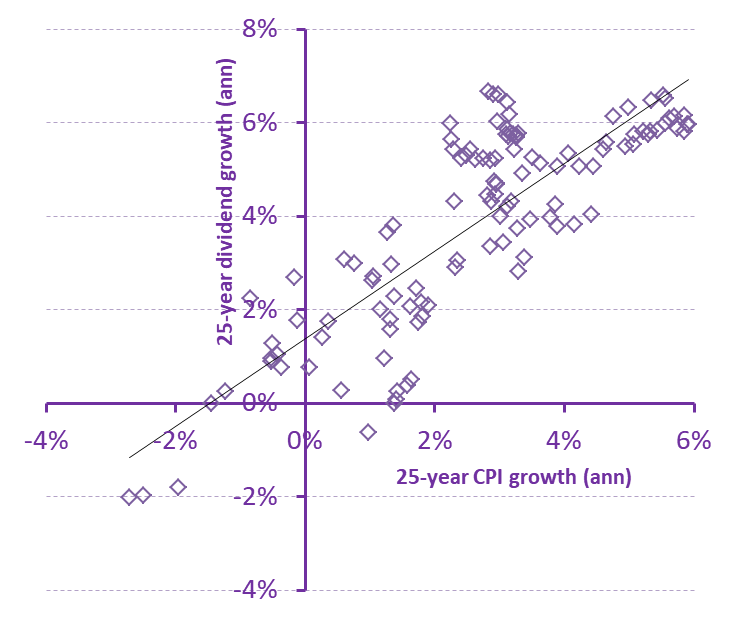
Figure 3: Dividend and inflation growth over rolling 25-year periods (annualized)
 |
 |
Source: Robert J. Shiller market data, Aaron Brask Capital
Figure 3 above provides two visualizations of the 25-year growth rates for S&P 500 dividends and the consumer price index (CPI). The first chart on the left shows how the 25-year growth rates for dividends and CPI evolving through time. While they broadly followed each other, the most recent data show inflation trending lower while dividend growth rates have sustained their near-peak levels. The second chart shows the same data in scatter chart. We believe this chart reveals at least one key point. In periods where CPI grew the most (data points to the right), dividends also grew at a significant rate. This would have been particularly important to those relying on dividends for retirement income since the growth in dividends would have been there when it was needed most.
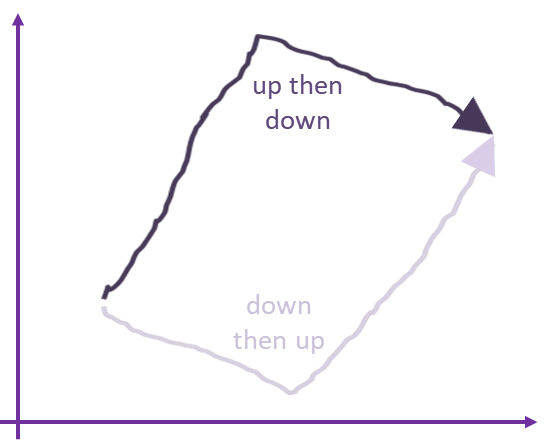
The above calculations utilized growth rates from 122 overlapping 25-year windows spanning the 1872-2019 period. In particular, each growth rate depended only upon its starting and ending value. Thus, even if the dividend/inflation correlation of 25-year windows was high, the intra-period trajectories of these quantities could be divergent. Figure 4 in the left panel below illustrates a hypothetical example of a period whereby the end result was the same for two quantities, but the trajectories were very different.
In order to assess the relationship between dividends and inflation at a higher resolution (i.e., within the 25-year periods), we made similar observations over smaller periods. Figure 5 shows the correlations calculated for rolling time periods ranging from five to 25 years. To be clear, the 25-years correlations in Figure 5 are the same as those presented in Figure 1. As expected, correlations increase with longer time periods. We attribute this to the noise we highlighted while discussing the theoretical underpinnings of this relationship (e.g., companies might temporarily absorb price increases before passing them on to their customers). Dividends show the highest correlations regardless of the time period chosen. Moreover, while not shown here, correlations between CPI and dividends fell to 34% for one-year time periods but increased to 95% with 50-year periods. On balance, we believe this indicates a strong relationship between dividends and inflation.
| Figure 4 : Same result via two different trajectories
Source: Aaron Brask Capital |
Figure : CPI correlations for different size periods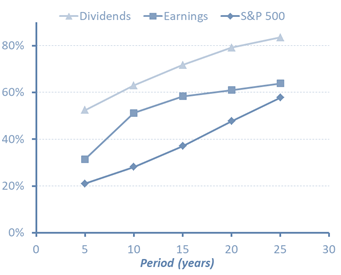
Source: Robert J. Shiller market data, Aaron Brask Capital |
To summarize, we highlight a few key points related to inflation:
- Natural economic forces impose a cause-and-effect relationship that make inflation positively correlated with corporate fundamentals and stock prices.
- Relative to market prices and earnings, dividends have been the least volatile and exhibited the strongest correlations with inflation.
- We believe these relationships are likely to sustain and dividends can provide a robust option for retirees and other investors seeking income that will keep up with inflation.
Dividends and market volatility
In the previous sections, we shared our conceptual model and data indicating how inflation relates to corporate fundamentals and stock prices. This section highlights two roles dividends can play in mitigating risks related to market volatility.
The first context focuses on using dividends as a source of income versus having to chisel away at a portfolio’s principal and thus being at the mercy of the market. Dividends depend on underlying operating performance of the company but are not at the mercy of fickle investors’ buying and selling. So this can reduce one’s dependence on market performance (see our Dividends Are Different article).
| Note: Our next article will revisit this notion of mitigating dependence on market performance as it can apply to fixed income allocations as well. |
The second context focuses on reducing rather than avoiding market volatility. Indeed, we believe dividends can be used to identify companies with higher quality fundamentals and less market volatility. However, not all dividend strategies are the same. There are two primary types of dividends strategies and they are effectively polar opposite in nature. Given the proliferation of indices, ETFs, and dividend-related products, it is easy to get confused. So we describe these two dividend strategies in the shaded boxes below.
High dividend yield strategiesMany dividend-based products and strategies target stocks that are paying high dividend yields. These are usually stocks that pay dividends, but have run into troubles – thereby sending their share price lower and making their dividend yield higher. Investors generally take notice of successful companies that consistently increase their earnings and dividends. This can keep their prices elevated and make their dividend yields lower. Accordingly, we find high dividend yield strategies often result in portfolios comprised of lower quality companies. Rising dividend strategiesThe second type of dividend strategy we highlight targets stocks that have consistently paid and raised dividends for an extended period. While these companies may have lower dividend yields, the quality of the underlying companies is typically much higher – as evidenced by their ability to pay and increase dividends. Accordingly, this approach is very different than pursuing higher dividend yields. |
For our purpose of investigating how dividend strategies can impact market performance, we focus on the latter dividend strategy. Our hypothesis is that companies that have consistently paid and raised their dividends are, on average, higher quality and exhibit lower market volatility. For this purpose, we consider the Vanguard Dividend Appreciation ETF (ticker: VIG). As the name indicates, this fund invests in companies that have records of growing their dividends. Moreover, it has a live track record going back to April 2006. So we can observe performance over at least one complete market cycle.
Of course, this is just one fund. So the evidence may appear anecdotal in nature. However, our research reflects similar trends whereby portfolios of higher quality companies tend to exhibit lower market volatility and reduced drawdowns – regardless of whether they pay dividends or not. We first present quantitative evidence indicating companies with histories of increasing dividends are high quality in nature. This is an obvious and unsurprising finding to us, but some prominent practitioners and academics maintain that dividend policies provide little, if any, useful information for investing purposes.
We used www.PortfolioVisualizer.com to examine our assertion regarding the quality of these types of companies and calculate key performance figures for returns, volatility, and drawdown.[5] Figure 6 below shows the tabular results from running the Fama-French five-factor regression for VIG. In layman’s terms, this model compares the historical performance of VIG to the performance of various factors portfolios (i.e., portfolios built to emphasize stocks with those specific factors) to statistically determine what flavors of stocks are in VIG. Technical details aside, the model indicates a significant and almost certain exposure to quality stocks as we suspected (profitability loading of +0.21 and p-value of 0.0%).
Figure 6 : Fama-French factor attribution for Vanguard Dividend Appreciation ETF (ticker: VIG)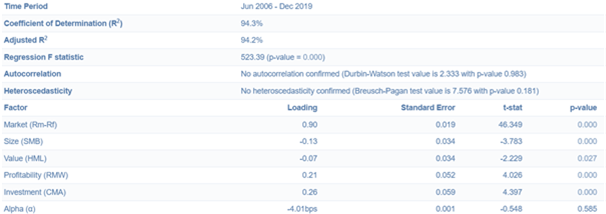
Source: www.PortfolioVisualizer.com
We believe the above results show how dividends can be used to identify higher quality companies. We now investigate how this is related to their market performance. We are particularly interested in how these types of stocks held up during turbulent periods. Figure 7 below shows the additional output from PortfolioVisualizer. Since its inception in 2006, VIG 8.92% on an annualized basis and this was almost identical SPY (an S&P 500 ETF) which returned 8.65%. However, the volatility and drawdown of VIG were both significantly lower than for SPY. The standard deviations of their returns were 12.75% for VIG and 14.52% for SPY and their drawdowns were -41% and -51%, respectively. This drawdown data is anecdotal since it only represents one particular event. So we investigated the data for the benchmark index VIG targets (NASDAQ US Dividend Achievers) and found similar results. While these results were actually stronger, it is worth noting that they were based on an index back-test rather than a live track record.
Figure 7: Vanguard Dividend Appreciation ETF (ticker: VIG) factor attribution
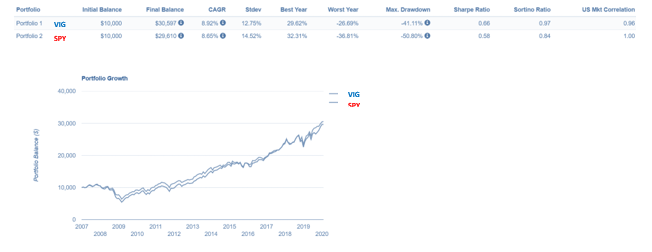
Source: www.PortfolioVisualizer.com
While some refuse to accept any role for dividends in portfolio construction or management, our intuition and historical data lead us to believe such views are dogmatic. We believe dividends possess important attributes with regard to inflation and market volatility that allow them to play a unique and critical role, especially in the context of retirement income planning.
Concluding remarks
This article first presented our theoretical model for how inflation relates to both corporate fundamentals and share prices. We then shared empirical results showing how dividend growth has been more strongly correlated with inflation than stock market returns or earnings growth. We also discussed and presented data describing how dividends could be used to bypass and possibly reduce stock market volatility.
We believe the empirical results regarding inflation corroborate the ideas behind our economic model as well as the notions we discussed in our previous article, Dividends Are Different. In particular, dividends are fundamental in nature and represent an economic phenomenon that is distinct from market prices and share buybacks.
At this point, refusing to acknowledge these unique attributes of dividends is effectively alleging the correlations we calculated were just a coincidence or manipulated by corporate managements. Given that these trends occurred over multiple time periods, we think the possibility of coincidence is de minimis. Moreover, that would be quite a conspiracy. Executives of companies from all sectors and across many time periods would have had to collaborated so that their dividend policies would aggregate in just such a way to conform to inflation trends over multi-decade periods.
We do not subscribe to any such conspiracies. We believe the dividend-inflation trends we highlighted represent a visible hand of capitalism at work as required returns on capital effectively push inflation through the economy’s profit mechanism. Since dividends are taken out of profits and paid to directly to investors, they are not subject to the sentiment of often-fickle investors. This is especially important since investors can react negatively to inflation and send market prices lower at a time when liabilities may be rising. As such, we believe they provide a better source of income for investors who have liabilities that will likely grow with inflation.
We believe retirees, in particular, can leverage the benefits of dividends we highlighted in this article to combat the deleterious effects of inflation and market volatility. Indeed, our next article will outline an innovative approach to retirement income that leverages these notions and can yield significant advantages over standard withdrawal methods in the contexts of costs, risk, performance, taxes, and transparency.
Disclaimer
- SET IT AND LEAVE IT ™ is an investment strategy developed by Aaron Brask Capital, LLC.
- This document is provided for informational purposes only.
- We are not endorsing or recommending the purchase or sales of any security.
- We have done our best to present statements of fact and obtain data from reliable sources, but we cannot guarantee the accuracy of any such information.
- Our views and the data they are based on are subject to change at any time.
- Investing involves risks and can result in permanent loss of capital.
- Past performance is not necessarily indicative of future results.
- We strongly suggest consulting an investment advisor before purchasing any security or investment.
- Investments can trigger taxes. Investors should weight tax considerations and seek the advice of a tax professional.
- Our research and analysis may only be quoted or redistributed under specific conditions:
- Aaron Brask Capital has been consulted and granted express permission to do so (written or email).
- Credit is given to Aaron Brask Capital as the source.
- Content must be taken in its intended context and may not be modified to an extent that could possibly cause ambiguity of any of our analysis or conclusions.
- PP&E stands for property, plant, and equipment. ↑
- This quote comes from Chapter 1, page 14 of William Bengen’s book Conserving Client Portfolios During Retirement (link). ↑
- We calculated intra-period standard deviations for each 25-year window and took an average. Standard deviations calculated over the entire 1872-2019 period show similar results, but we chose to present the average of intra-period standard deviations to account for potentially changing inflation regimes (i.e., the mean used to calculate each standard deviation was more specific to that particular period – not a universal average). ↑
- Hedonic adjustments attempt to remove price changes due to the changing quality of the underlying goods. You can read more about hedonic adjustments here. ↑
- Drawdown is defined as the maximum percentage fall a portfolio has experienced over a particular period. ↑